Logging
Logging
The Logging function checks real-time call attempts, SIP traces, routing status, and to simulate a call. As soon as a call hits the ConnexCS system, it will display in the Logging area. Most issue debugging occurs in the Logging section.
Register Logging
To view calls that are having issues registering, click Register Logging, then click on a specific Call ID to view Call Details and SIP Trace.
Fraud Logging
View the log of Fraud events. See Setup Fraud Detection for configuration.
Simulate
Simulating calls allows providers to identify areas of concern, or just to verify functionality, by testing in different setups and operational configurations.
To Simulate Calls:
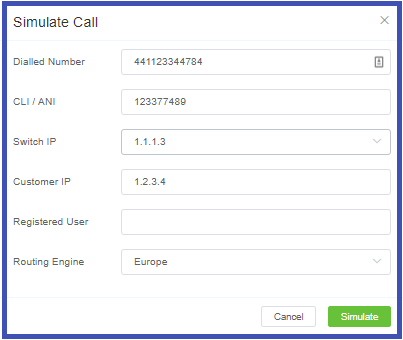
Click Simulate either from the Logging screen or from within a specific Call ID:

- Dialed Number: Where the call will terminate (destination).
- CLI/ANI: Where the call will originate from (configured on ConnexCS).
- Switch IP: Where the call will traverse.
- Customer IP: The ConnexCS Customer IP address where the call will originate.
- Registered User: (Optional) Enter a SIP extension user.
- Routing Engine: Select the regional zone.
Click Simulate.
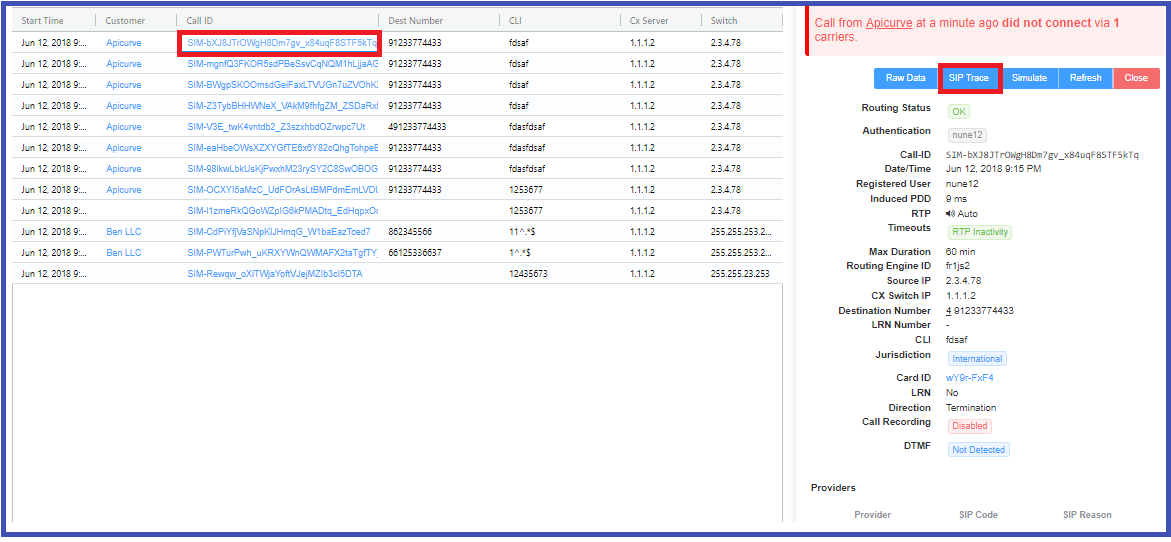
The simulation call result will appear in logging. The Call ID will begin with a SIM tag. Click the Call ID to view the call's routing status.
Testing a fixed issue
After you have fixed a routing issue with a specific call, you can go into the Call ID and run the Simulate tool to make sure any routing issues are resolved and now pass.
Searching the Logs
You can search for calls by phone number, Call ID, or IP address, by entering one of these attributes into the text box at the top-right of the Logging page and clicking the Search button.
Call ID Details
Click on a specific Call ID to view details and run call tools.
- Call Details: The initial screen shows current details which include Routing Status, Authentication, Induced PDD, RTP, Routing Engine ID, DTMF, as well as several other pieces of information. At the bottom, view the Providers, Billing details and RTP information such as Jitter and Packet Loss.
- Raw Data: Underlying data that populates for the call.
- SIP Trace: Visual representation of SIP communications, see details below under SIP Traces.
- Simulate: See details above for Simulating Calls.
- Class5: If the Class5 system is used, there will be some additional information such as Request Parameters.
- Refresh: For Live calls, use the
Refreshbutton to reload the logs to show the most recent changes. This is necessary as some of the data must be processed through CDR before it will be displayed.
More on Call-IDs
See Call-ID for further information and troubleshooting.
SIP Traces
SIP Tracing is a diagnostic tool for phone systems using SIP (Session Initiation Protocol) for interactions across trunks and between endpoints. Traces give detailed information about calls and call attempts when debugging and troubleshooting. Since SIP protocol is used for call setup, maintenance, and tear-down, this tool is typically only used for call connection issues. Call quality issues are usually identified using other methods.
SIP Trace Captures
The ConnexCS system supports always-on SIP Trace capture. We keep a record of every packet sent and received by your server over the last seven (7) days.
To view the SIP Trace of a call:
- Click a Call ID to view its SIP traces.
-
Click the
SIP tracesbutton to view the SIP trace.
-
Toggle between Relative Time and Absolute Time for specific time of day
- Options to download as Text or an Image
Known issues with SIP Traces
- Missing SIP data: SIP traces are not always guaranteed. SIP packets are carried by UDP, which may cause the traces to be lossy at times. This is to be expected due to the nature of the architecture.
- Missed call attempts: If using SIP authentication, because there are 2 requests it is possible that they hit our database out of order. This may cause the logging page to only display the first call attempt.
- These are considered reporting calls, and do not impact the calls directly. They are both rare, typically observed in less than 1 in every 50,000 calls